| Fig.8
sets out to show the error resulting from wrongly computing Cheese Rock
depths by reference to the height of the tide at Menai Bridge. The
Marine Science Labs, Menai Bridge produce individual Tide Tables for each
of the places along the Strait, (Menai
Strait Tide Tables)
which include the predicted height of the tide at Menai Bridge at hourly
intervals throughout the year. Close examination of these latter
show them simply to be the standard semi-diurnal sine curve, which given
the effect on the tide of the restrictive environment may not faithfully
reflect reality. But in the absence of anythiong better, Fig.8 also
uses the sine curve to show in blue the height of the tide above MTL at
Menai Bridge, and the consequent (eroneous) depth over the rock which would
result from using M.Bdge to figure the depth. This may be compared
with Richard Jones' actual measurements. (see
his graph)
The red curves I'll explain in the following. |
|
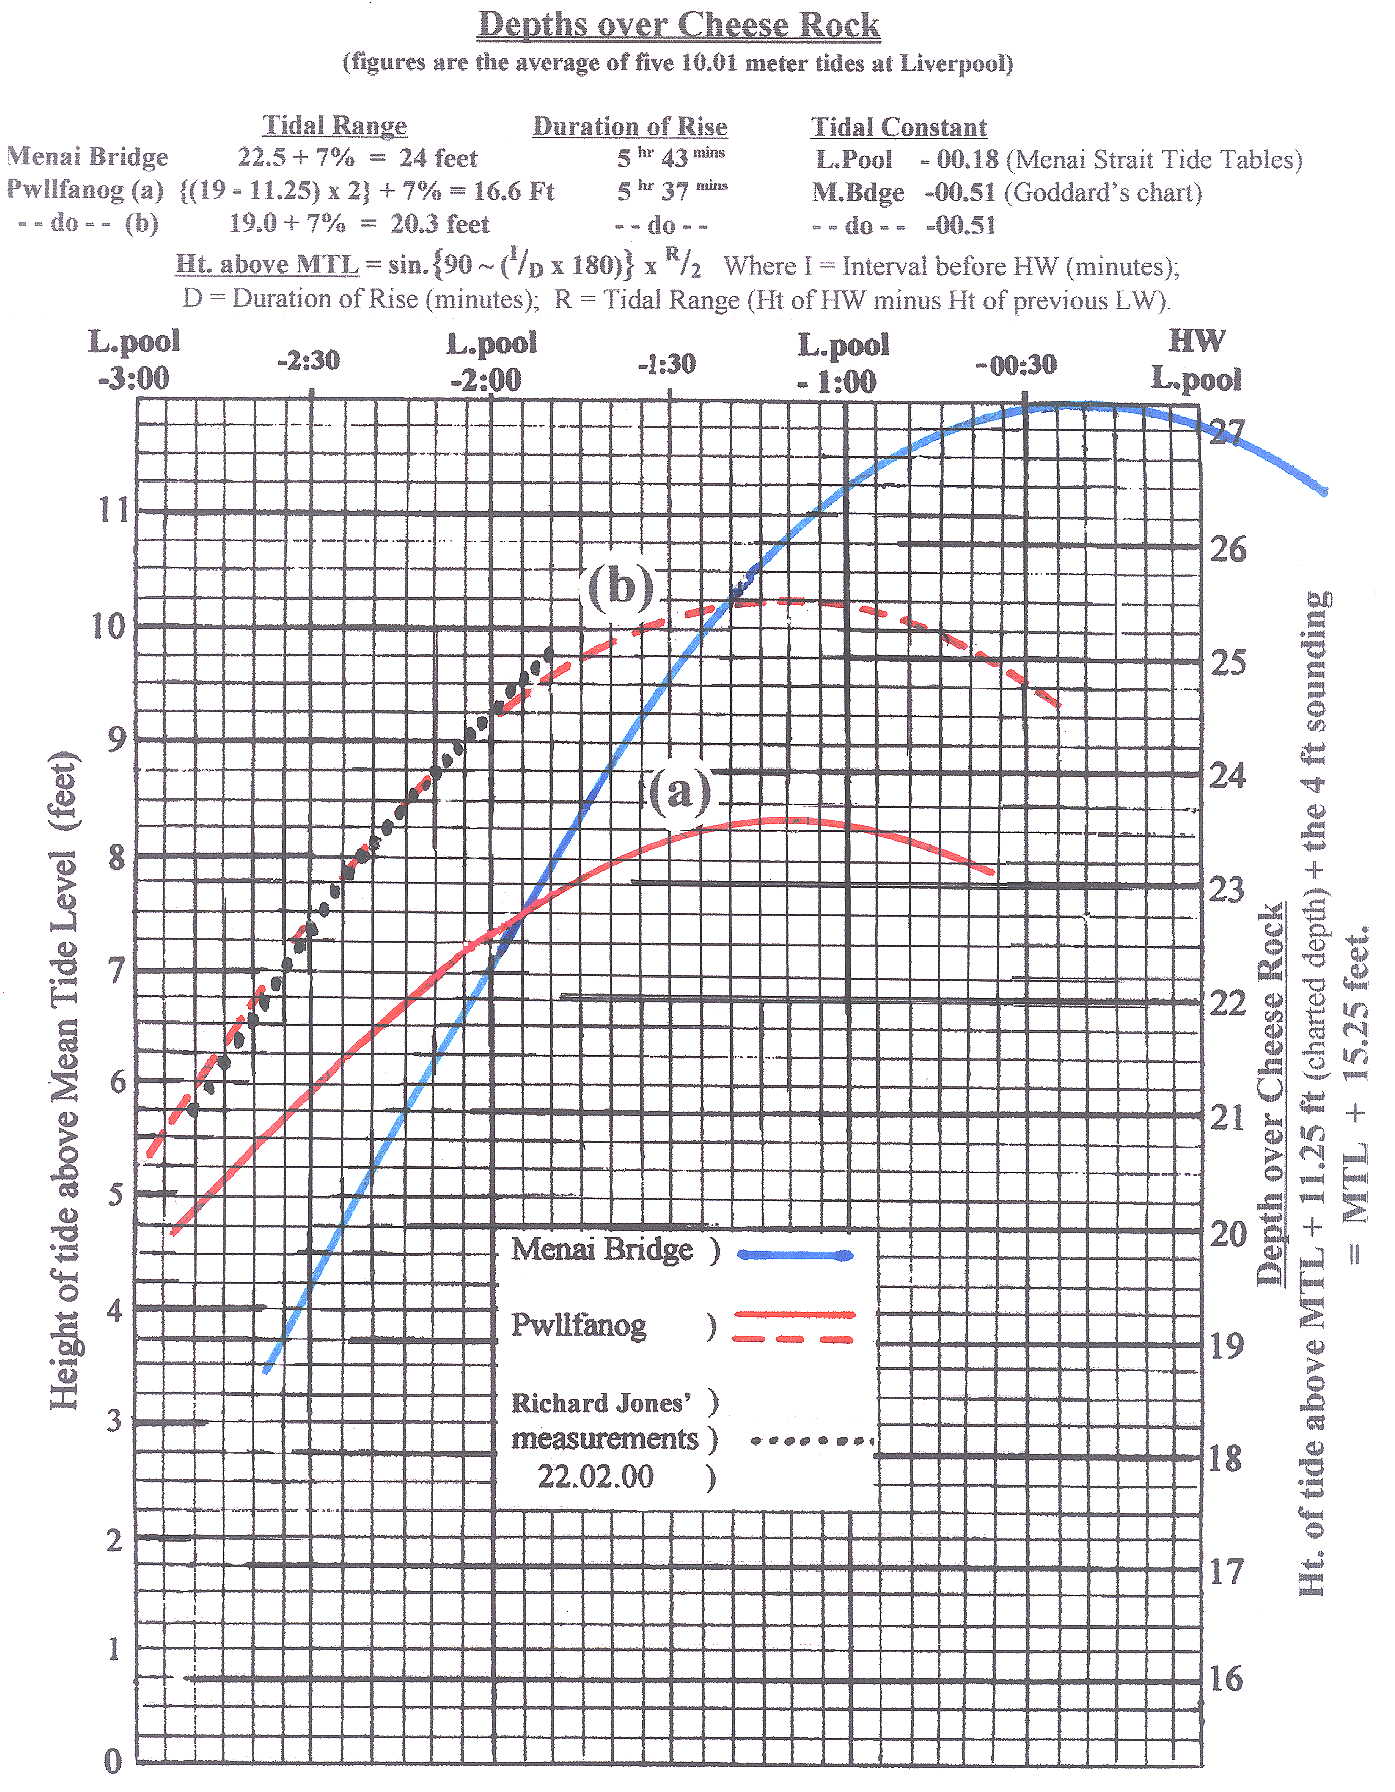 Fig.8
Fig.8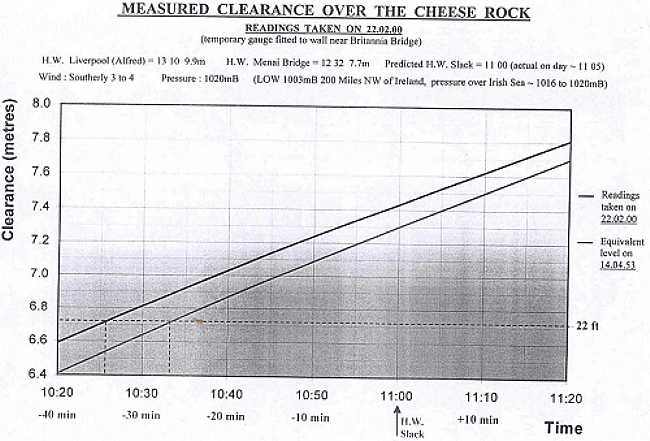